


Chapter 4 – Built & Natural Infrastructure
4.1 Natural Infrastructure
Marine Shoreline and Budd Inlet
4.2 Built Infrastructure
Collection and Conveyance Facilities
Tables
Table 4.1 Streams in Olympia
Table 4.2 Wetlands in Olympia Watershed
Table 4.3 Larger Lakes in Olympia
Table 4.4 Stormwater Infrastructure Summary
Table 4.5 Storm Gravity Collection Pipe Inventory
Table 4.6 Flow Control Structures
Table 4.7 Treatment Facility Inventory
Figures
Figure 4.1 Pre-Development Water Cycle
Figure 4.2 Land Cover in Olympia Watersheds, 2013
Maps
Map 4.1 Types of Land Cover in Olympia (WDFW High Resolution Land Cover 2013)
Map 4.2 Combined Storm & Sanitary Sewer System
Map 4.3 City of Olympia Storm & Surface Water Infrastructure
Olympia’s stormwater management system depends upon both natural and built infrastructure to provide basic functions. In natural systems, rain collects in wetlands and lakes, filters into the ground, flows into streams, and eventually makes its way into Puget Sound. The built stormwater infrastructure mimics these functions: channeling rainwater runoff into streams, wetlands, lakes, and finally Puget Sound; storing water after heavy rains so it can infiltrate, evaporate, or release to the conveyance system at a controlled rate; and treating or filtering the water to remove pollutants. The built infrastructure includes:
• Conveyance. Gravity storm pipes, ditches and culverts channel surface runoff from structure to structure or into streams, rivers, and other water bodies.
• Flow Control. Constructed ponds and vaults and/or wetlands and natural features manage excess runoff volume and flow timing.
• Treatment. Stormwater is treated as it passes through a treatment facility or is filtered naturally in the soil, wetlands, and streams.
This chapter describes the natural and built infrastructure and how they function together to manage Olympia’s storm and surface water to prevent flooding, improve water quality, and protect and enhance aquatic habitat. Chapters 6, 7, and 8 describe the current conditions of flooding, water quality, and habitat. Chapter 10 explains how Utility plans to address these conditions over the next 10 years through its Goals, Objectives, and Strategies.
4.1 Natural Infrastructure
Natural systems of water, land, and air are the foundation of all life and provide many tangible and intangible benefits. Natural infrastructure serves surface water management functions by regulating water flows, water quality, nutrient cycling, and sediment transport or retention. Natural aquatic systems also provide fresh water and habitat for many organisms.
A 2010 study placed a monetary value on the hydrologic, water quality, and habitat benefits of natural systems in the Puget Sound Basin. The study valued basin-wide ecosystem services from $9.5 billion to $83.4 billion per year for various habitat types (Batker et al 2010). This approach begins to demonstrate the economic value of natural systems in provisioning, regulating, and supporting natural processes and resources and adding to the community’s cultural, recreational, and aesthetic attractions.
This section defines the elements of the natural systems: the landscape of a watershed, streams and riparian areas, wetlands, and marine shorelines. It focuses on how they function as stormwater “infrastructure.” Chapter 8 describes the existing condition of these ecosystems as habitat for aquatic and terrestrial species.
Hydrology
The science of hydrology studies the movement of water in the atmosphere, across the landscape, and beneath the ground surface. In its simplest form, hydrology is an accounting of water resources at various stages in the water cycle as precipitation interacts with vegetation, soils, and urban surfaces such as roofs and pavements, as water flows across the landscape into marine waters. In undisturbed forests of Western Washington and British Columbia, water budget studies report that as much as 40 percent of annual rainfall is intercepted by trees and vegetation, and then evaporated back to the atmosphere. Another 20 to 30 percent is retained the highly organic upper soil surface layers of native soils. Approximately 10 to 40 percent of annual precipitation percolates through the soil to deeper groundwater stores. Shallow subsurface flow through soils occurs slowly, occasionally resurfacing at streams, wetlands, and other surface waters (Bauer and Mastin, 1997). Studies such as this confirm that very little surface runoff – less than 1 percent – occurs in an undisturbed watershed. See Figure 4.1.
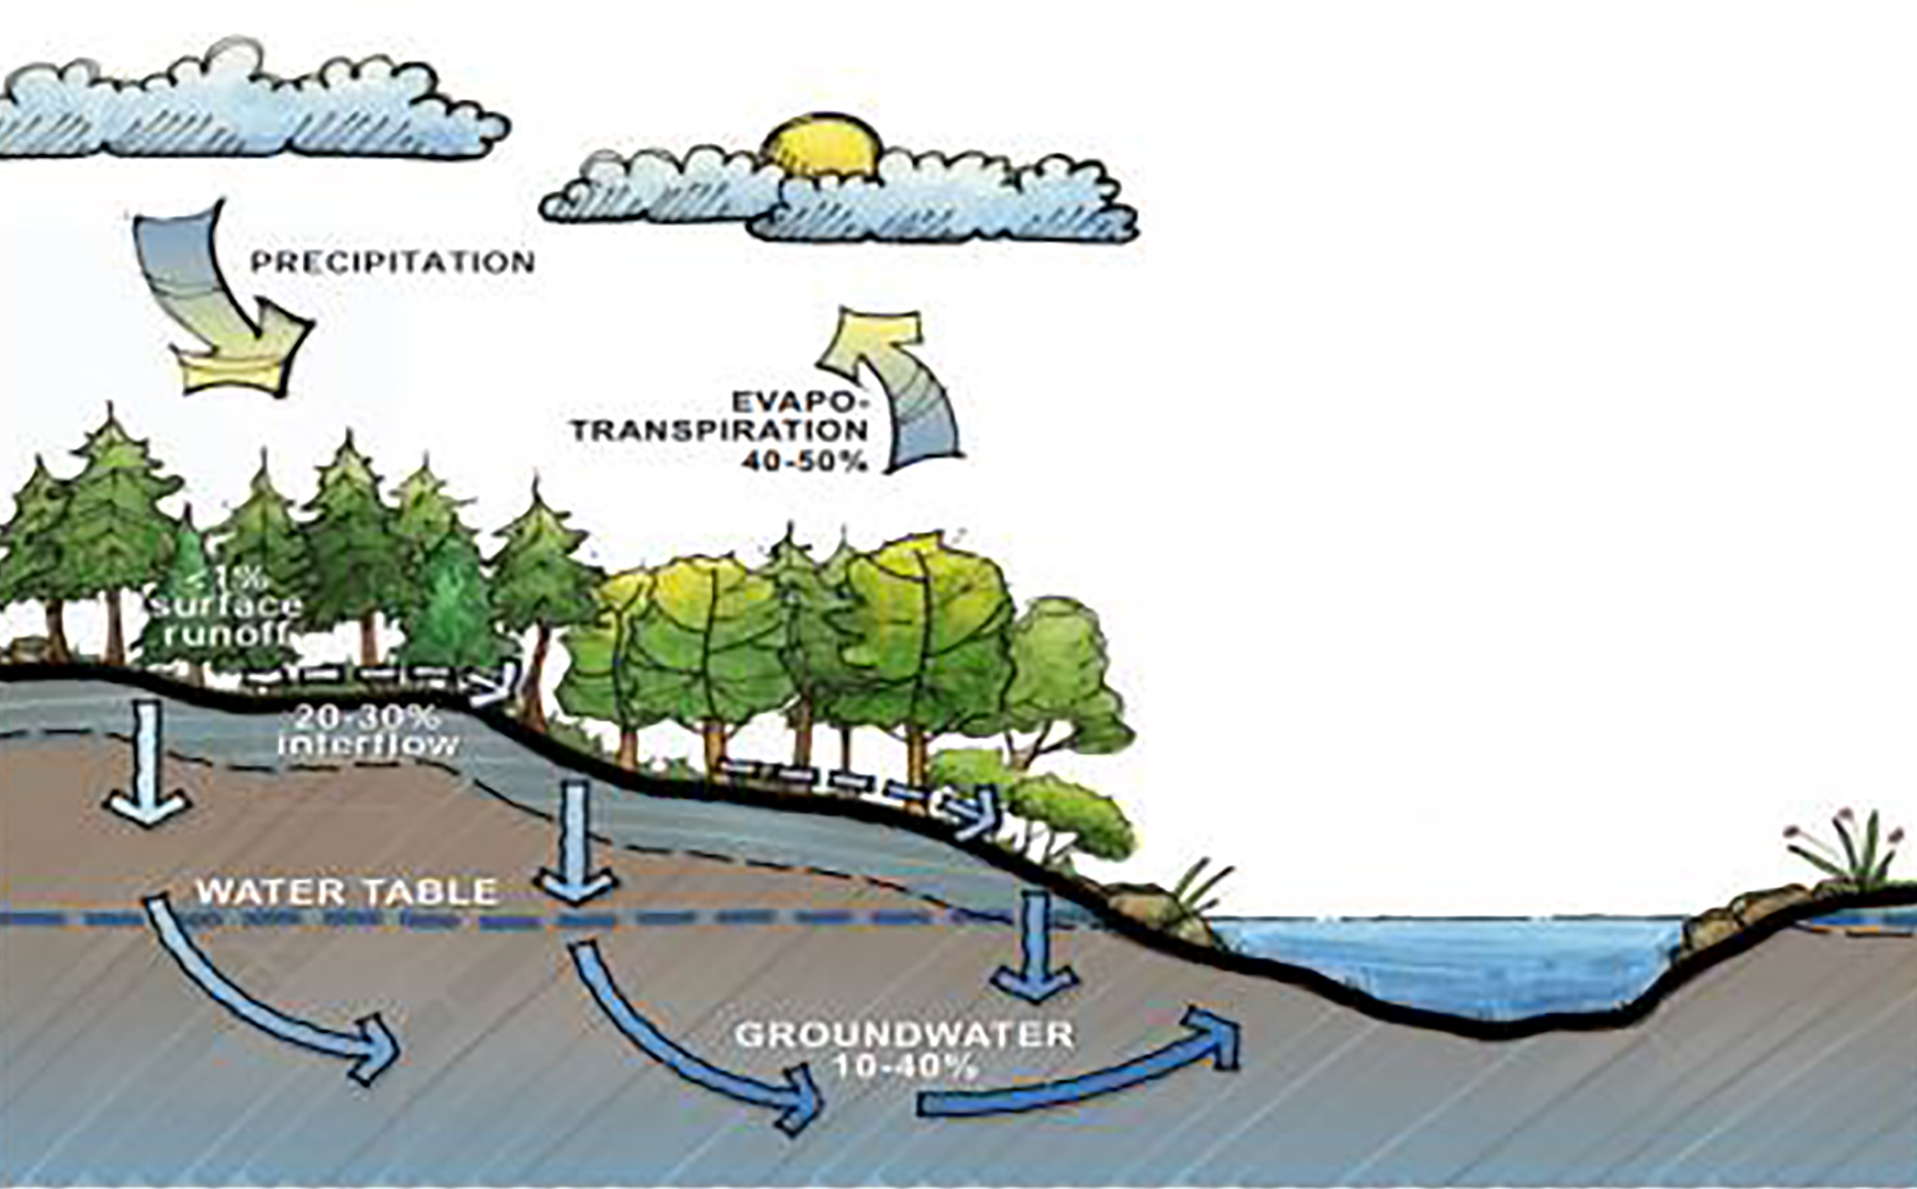
View Figure 4.1 Pre-Development Water Cycle
(Source: Puget Sound Partnership, 2012)
Watersheds
A watershed is the land area that drains into a specific creek, lake, or other water body. In undeveloped conditions, the entire landscape – including forests, fields, soils, lakes, streams, ground water, and wetlands – forms the natural infrastructure that influences water transport, storage, and quality. As quantified above, in a natural forested landscape, most rainwater seeps into the ground or is used by plants, and the remaining runoff flows slowly into streams, lakes, and wetlands or directly into Puget Sound.
Impact of Urbanization
Urban development interrupts these natural processes: increasing impervious cover (e.g. roofs, parking lots, streets, and sidewalks), compacting the ground during construction, and removing the natural vegetation micro-topography that captures rainfall and aids infiltration. This type of land cover conversion, which is typical of conventional development techniques, dramatically increases surface runoff by approximately 30% (LID Guidance from Ecology/Herrera citation). The result is increased peak flows and duration of flows, increased erosion and sedimentation, and lower summer stream flows. Urban stormwater runoff carries pollutants from vehicles, animal wastes, fertilizers, and other sources into water bodies.
Patterns of development in a watershed – the amount of impervious surfaces, forest cover, and natural vegetation – influence how much rainwater filters into the ground and how much runs off into catch basins, pipes, stormwater ponds, natural wetlands, and streams. Watersheds with more effective impervious surfaces suffer more degradation to the natural system. Map 4.1 shows the various types of land cover in Olympia. Figure 4.2 shows how widely Olympia’s watersheds vary in the extent of impervious surface and the type and quality land cover.
Managing Impacts
Past zoning, development practices, and lack of stormwater regulations have contributed to negative impacts on natural systems. In recent years, the City has tried to correct past problems and prevent or mitigate future impacts. Stormwater management focuses on quantifying the amount of rainfall that becomes surface runoff and mitigating the effects – both for quantity and water quality of this runoff. Various federal, State, and local regulations are intended to protect natural systems, and maintain their hydrologic, water quality, and habitat functions. See Chapters 5, 6, 7, and 8 for details about these regulations.
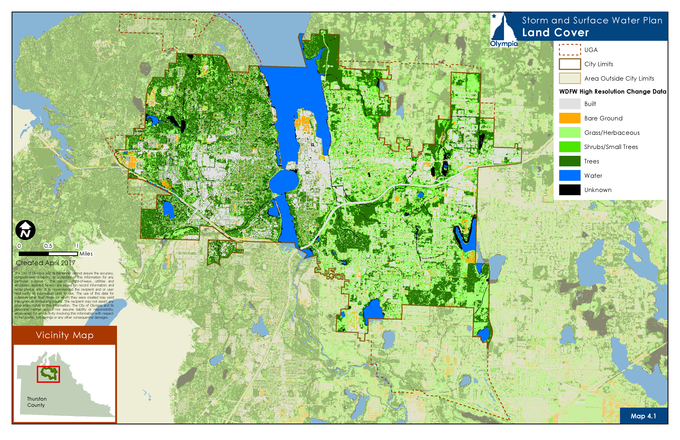
View Map 4.1 Types of Land Cover in Olympia (WDFW High Resolution Land Cover 2013)
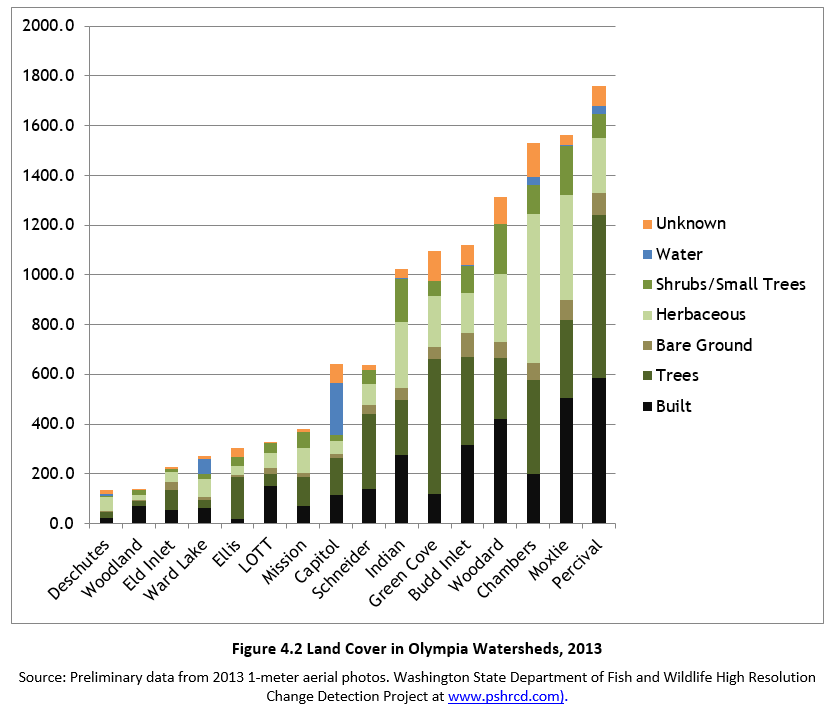
View Figure 4.2 Land Cover in Olympia Watersheds, 2013
Source: Preliminary data from 2013 1-meter aerial photos. Washington State Department of Fish and Wildlife High Resolution Change Detection Project at www.pshrcd.com.
Streams and Riparian Areas
Stream channels are pathways for surface water runoff, groundwater from seeps and springs, and outflows from wetlands and lakes flowing into larger waterways. Streams also transport cobbles, gravels, and other sediments to downstream channel reaches and the shoreline, beaches, and mudflats of Puget Sound. Table 4.1 lists streams that flow through Olympia, showing how much of their main channel and tributaries are within the City and how much are piped.
Riparian areas are the forests and plant communities adjacent to streams, wetlands, and lakes that directly influence their water quality and habitat. Forested riparian areas provide the most benefit to aquatic systems. Large trees cool the air and water temperature with their shade. They support aquatic habitat by producing wood, leaf litter, and nutrients that support food webs. Fallen trees become habitat for aquatic life and control the movement of gravel and sediment. Roots of riparian vegetation capture sediment, reducing erosion by holding together stream banks; roots also filter water before it reaches the stream, absorbing large amounts of nitrogen and phosphorus.
By contrast, quickly routing stormwater into pipes and streams reduces infiltration into the soil and prevents groundwater recharge that otherwise would add to dry season stream flow.
Reported monetary values for ecosystem functions provided by riparian forests range from $1,144 - $26,844 per acre/year, depending on the age of the forest and other factors (Batker et al 2010).
|
Stream |
Total Main Stem Length1 |
Length in City Main Channel (Tributaries) |
Piped Length in City |
Other Jurisdictions1 |
|---|---|---|---|---|
|
Black Lake (Ditch) |
2.39 |
0.67 (0.0) |
0.02 |
Thurston Co |
|
Budd Inlet (Small Tribs) |
N/A |
0 (3.73) |
N/A |
Thurston Co |
|
Chambers (Ditch) |
2.54 |
0.66 (0.0) |
0.02 |
Thurston Co |
|
Ellis Creek |
1.24 |
0.89 (2.42) |
0.13 |
Thurston Co |
|
Garfield Creek |
0.54 |
0.54 (0.06) |
0.08 |
N/A |
|
Green Cove Creek |
5.74 |
1.56 (3.34) |
0.08 |
Thurston Co |
|
Indian Creek |
3.53 |
2.83 (4.44) |
1.163 |
Thurston Co |
|
Mission Creek |
2.13 |
2.00 (1.00) |
0.15 |
Thurston Co |
|
Moxlie Creek |
2.07 |
2.07 (2.94) |
0.87 |
Tumwater |
|
Percival Creek |
4.05 |
1.87 (0.71) |
N/A |
Tumwater, Thurston Co |
|
Schneider Creek |
2.19 |
2.19 (0.64) |
1.024 |
N/A |
|
Woodard Creek |
7.75 |
2.22 (0.67) |
0.32 |
Thurston Co, Lacey |
|
Woodland Creek |
6.17 |
0 (0.0)2 |
N/A |
Thurston Co, Lacey |
Source: Utility GIS data
1 Measurements are in miles.
2 Some portions of the watershed are within the City but not the stream channel.
3 Includes Indian Creek Bypass, a 0.28-mile long secondary channel.
4 Upstream (south) of Giles Avenue is piped.
Wetlands
Wetlands are among the most productive ecosystems in the world. Besides sustaining many plant and animal species, they can improve water quality, reduce erosion and flooding, and even moderate the effects of climate change. Wetlands are areas that are inundated or saturated by surface or groundwater frequent enough to support vegetation adapted for saturated soil conditions.
Wetlands retain surface runoff, slowing peak flows into streams, helping to prevent erosion and impacts to aquatic life. Many wetlands also recharge local aquifers and groundwater, increasing the release of cool, clean water into streams during the dry summer months. Wetlands also provide water quality benefits. Wetlands slow the flow of water, allowing sediments and attached pollutants to settle out of the water column. Plants, growing rapidly in wetlands, filter water by removing nitrogen and other nutrients. The lack of oxygen in wetland soils slows the decomposition of organic matter, preventing the release of carbon captured by vegetation to the atmosphere.
During the past 150 years, an estimated 31% of wetlands in Washington State have been drained and filled. The largest losses (up to 90%) have occurred in the urbanized watersheds around Puget Sound. As shown in Table 4.2, an estimated 3,150 acres of wetland remain in watersheds partially within Olympia, including about 680 acres within City limits. These are only estimates, since detailed wetland mapping must done on a site-by-site basis and requires confirmation of soil, hydrology, and vegetation criteria.
The loss of wetlands in a watershed reduces their beneficial effects on flooding and surface water quality. Batker et al (2010) report annual ecosystem service values for wetlands ranging from $14,377 - $71,103 per acre/year.
|
Watershed Name |
Total Acres of Wetland |
Acres of Wetland in Olympia City Limits |
% of Basin in Wetland1 |
% of Basin Unmodified Wetlands2 |
|---|---|---|---|---|
|
Chambers |
765.5 |
177.4 |
10% |
8.9% |
|
Ellis Creek |
427.5 |
37.1 |
30% |
17.4% |
|
Green Cove Creek |
290.8 |
88.6 |
11% |
11.6% |
|
Indian Creek |
154.9 |
55.0 |
12% |
10.1% |
|
Mission Creek |
30.2 |
29.4 |
7% |
5.1% |
|
Moxlie Creek |
54.9 |
51.4 |
4% |
5.0% |
|
Percival Creek |
367.1 |
61.2 |
8% |
7.1% |
|
Schneider Creek |
2.0 |
2.0 |
>1% |
0.8% |
|
Woodard Creek |
585.1 |
172.3 |
12% |
13.8% |
|
Woodland Creek |
474.7 |
4.8 |
5% |
9.2% |
|
TOTAL |
3152.7 |
679.2 |
|
|
Note: All data are estimated.
1 Source: Thurston Regional Planning Council National Wetlands Inventory mapping. This data is approximate and does not capture all wetlands.
2 Source: Basin Evaluation and Management Strategies – Thurston County, Table 10 (TRPC 2013).
Lakes
The four lakes in Olympia that are larger than 20 acres are regulated under the State Shoreline Management Act: Capitol Lake, Chambers Lake and Little Chambers Lake, Ken Lake, and Ward Lake (Table 4.3). Smaller lakes and ponds are D’Miller Lake, Lake Louise, Setchfield Lake, Hazard Lake, and Smith Lake. All lakes in Olympia are at least partially privately owned. The Washington Department of Enterprise Services owns and manages Capitol Lake. Each lake is unique and interacts with the surrounding landscape, surface water, and groundwater in different ways. For example, Capitol Lake was created by damming the Deschutes River, and outlets directly to Budd Inlet. Others are the result of glacial activity and/or shallow ground water. In the Olympia area, many ponds, lakes and/or wetlands occur in glacially formed “kettles” or depressions. They typically have no surface water inlets and/or outlets and are often directly connected to the water table. Ward Lake, Ken Lake, and Hazard Lake are examples of this type of system.
Lakes serve the stormwater management functions of storage and flow control. Like wetlands, they collect runoff and release it slowly. Lake water level often directly reflects the local ground water table. They can be highly influenced by nutrients that contribute to algae blooms, low dissolved oxygen, and other problems. Thurston County is the lead agency responsible for the larger lakes in Olympia.
|
Lake Name |
Acres |
Notes |
|---|---|---|
|
Capitol Lake |
270 |
• Mouth of Deschutes River, created by 5th Avenue Dam • Managed by State Department of Enterprise Services • Mean depth 9’, maximum depth 20’ |
|
Chambers Lake (and Little Chambers) |
63 and 58 |
• Shallow lake (maximum depths 5-7’) and associated wetlands, flows to Chambers Ditch in Southeast Olympia |
|
Ward Lake |
66 |
• No outlet, maximum depth 67’ |
|
Ken Lake |
27 |
• Small lake in Southwest Olympia with manmade outlet |
Data from WRIA 13 Watershed Assessment (Accessed at http://www.thurstoncountywa.gov/sw/Pages/basin-plan-wria13.aspx
Marine Shoreline and Budd Inlet
Olympia lies on the shoreline of Budd Inlet, at the southernmost end of Puget Sound. Of the 10.4 miles of shoreline within the City and its Urban Growth Area (UGA), about 73% is modified, primarily by armoring with bulkheads. Fill placed in the late 1800s through the 1980s created most of the Port of Olympia peninsula separating West Bay and East Bay. In 1951, a dam was constructed at 5th Avenue, creating Capitol Lake from mudflats at the mouth of the Deschutes River. These shoreline modifications reduce sediment supply to local beaches and habitat for various fish, shellfish, and their food sources. The east and west sides of Budd Inlet are primarily steep bluffs; the southern shoreline, created over the years by the filling of tideland, is generally flat.
Recently, regional awareness and initiatives have brought attention to how actions and decisions throughout the region affect the health of Puget Sound. Pollutants, nutrients, fine sediment, and bacteria are all transported into the Sound by runoff from streams, rivers, and thousands of pipes. This pollution creates problems for shellfish, juvenile salmon and other life using the Sound and shoreline.
4.2 Built Infrastructure
Stormwater management practices and infrastructure have changed significantly in recent decades. Prior to the 1980s, Olympia’s stormwater infrastructure consisted of ditches and pipes, often combined with sanitary sewer. The original infrastructure was designed simply to transport stormwater runoff away from developed land to protect people and property. As developed areas expanded, stormwater runoff increased, causing severe flooding and erosion.
The Utility’s early efforts to address these problems aimed to reduce excess flows by requiring detention ponds that capture and detain stormwater runoff from developed areas. With increased understanding of water quality and habitat impacts, stormwater management practices have incrementally improved, aiming to simulate natural systems and mitigate negative impacts.
Currently, most of Olympia’s built infrastructure is a storm sewer gravity system, separate from the sanitary sewer. However, an aging combined storm and sanitary sewer system still serves the downtown area and adjacent neighborhoods to the northeast, east, and southeast of downtown (see Map 4.2).
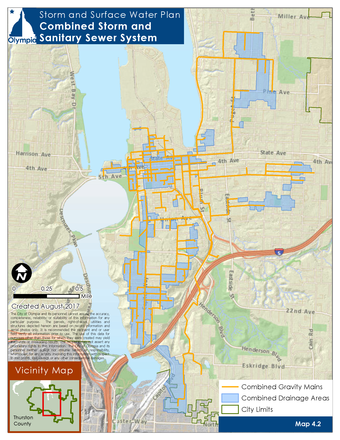
View Map 4.2 Combined Storm & Sanitary Sewer System
System Overview
Olympia’s built infrastructure is a network of public and private systems that work together with gravity to convey, control, and treat stormwater. In general, facility design attempts to supplement or replace natural functions of forests and wetlands by slowing, retaining, and filtering runoff from impervious surfaces. Stormwater facilities include conveyance structures like pipes, swales, ditches, culverts, street gutters; and flow control structures and/or treatment structures like detention ponds, retention ponds, constructed wetlands, infiltration devices, catch basins, oil/water separators, and biofiltration swales. See Map 4.3.
To carry stormwater runoff from roads and other hard surfaces to streams and Budd Inlet, the Utility maintains over 160 miles of underground pipe (separated sewer), more than 7,400 catch basins, approximately 1,400 manholes, 167 flow control structures, and 129 stormwater treatment facilities. Table 4.4 summarizes this infrastructure; see Tables 4.5, 4.6, and 4.7 for inventory detail.
An additional 20.7 miles of combined sewer pipe, maintained by the Wastewater Utility, convey runoff to the LOTT Clean Water Alliance Budd Inlet treatment plant.
|
Infrastructure Type |
City Owned or Maintained |
Privately Owned |
|---|---|---|
|
Catch Basins and Inlets (number) |
7,444 |
5,760 |
|
Conveyance Pipes (miles) |
160 |
143.8 |
|
Ditches and Swales (miles) |
21.7 |
9.2 |
|
Flow Control Facilities (number) |
167 |
852 |
|
Treatment Facilities (number) |
129 |
523 |
Collection and Conveyance Facilities
Natural and built drainage facilities collect, contain, and convey the flow of surface and stormwater from the highest points on the land down to a receiving water. Natural elements of conveyance systems include swales and small drainage courses, streams, and rivers. Built conveyance systems include gutters, ditches, pipes, and culverts.
Most of the definitions of system components described below are from Washington State Department of Transportation (WSDOT) Glossary of Terms.
Gravity Storm Pipes
Gravity storm pipes are typically part of a closed pipe network that conveys surface water between inlets, catch basins, manholes, facilities and outfalls. Table 4.5 summarizes Olympia’s stormwater gravity collection pipe inventory, showing diameter, length, and materials. The condition of these pipes varies with age, type of materials, and location. Inspection shows the current condition of the storm gravity mains as follows:
• 44% of the pipes are in good condition
• 6% are in fair condition
• 12% are in poor condition
• 38% remain to be inspected
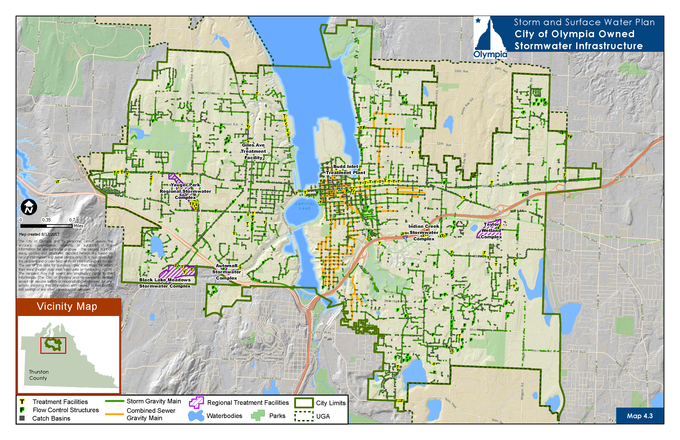
View Map 4.3 City of Olympia Storm & Surface Water Infrastructure
Culverts
Culverts are pipes or concrete box structures that drain open channels, swales, or ditches under a roadway or embankment. Typically, there are no catch basins or manholes along their length. The Utility has mapped 5.76 miles of public culverts and 0.83 miles of private culverts within the City.
|
Pipe Diameter (inches) |
Cast Iron/Ductile Iron |
Concrete |
Corrugated Metal |
HDPE |
PVC |
RCP |
Steel Trestle |
Vitrified Clay |
Other or Unknown |
TOTAL Pipe Length (feet) |
|---|---|---|---|---|---|---|---|---|---|---|
|
4 |
615 |
914 |
6 |
549 |
2,451 |
|
|
1 |
1,988 |
6,524 |
|
6 |
2,292 |
51,073 |
2,838 |
1,775 |
26,305 |
157 |
|
7,070 |
11,216 |
102,726 |
|
8 |
7,445 |
68,404 |
17,529 |
6,920 |
72,056 |
1,505 |
29 |
5,559 |
14,402 |
193,849 |
|
10 |
226 |
22,236 |
8,964 |
677 |
14,364 |
462 |
|
1,726 |
2,150 |
50,805 |
|
12 |
12,659 |
48,071 |
18,394 |
90,048 |
55,239 |
6,102 |
307 |
3,336 |
12,123 |
246,279 |
|
14 |
160 |
90 |
|
|
|
|
|
|
|
250 |
|
15 |
139 |
13,818 |
6,098 |
10,611 |
6,165 |
5,493 |
|
1,996 |
2,443 |
46,763 |
|
16 |
|
|
|
177 |
|
517 |
|
|
|
694 |
|
18 |
2,554 |
7,895 |
4,982 |
20,686 |
6,263 |
8,051 |
|
439 |
3,169 |
54,039 |
|
20 |
|
|
|
|
|
84 |
|
|
|
84 |
|
21 |
|
922 |
1,481 |
666 |
1,375 |
2,849 |
|
|
|
7,293 |
|
24 |
281 |
5,482 |
7,163 |
17,971 |
830 |
15,659 |
405 |
1,257 |
606 |
49,654 |
|
30 |
|
4,118 |
2,808 |
5,434 |
297 |
5,245 |
|
2,133 |
326 |
20,361 |
|
35 |
|
|
101 |
|
|
|
|
|
62 |
163 |
|
36 |
34 |
3,314 |
4,490 |
4,172 |
|
5,788 |
426 |
|
859 |
19,083 |
|
40 |
305 |
|
|
|
|
146 |
|
|
|
451 |
|
42 |
313 |
3,534 |
1,012 |
511 |
|
922 |
|
|
60 |
6,352 |
|
48 |
|
|
1,025 |
1,573 |
|
850 |
405 |
|
|
3,853 |
|
54 |
|
|
1,412 |
|
|
867 |
|
|
|
2,279 |
|
66 |
|
|
128 |
|
|
|
|
|
|
128 |
|
72 |
|
|
1,034 |
|
|
2,680 |
|
|
|
3,714 |
|
Other |
|
|
315 |
|
|
|
|
|
|
315 |
|
Unknown |
73 |
183 |
133 |
|
63 |
|
|
|
26,060 |
26,512 |
|
Total Lengths of Each Pipe Type and Percentage of Total System Length |
||||||||||
|
Feet |
27,096 |
230,054 |
79,913 |
161,770 |
185,408 |
57,377 |
1,572 |
23,517 |
75,464 |
842,171 |
|
Miles |
5 |
44 |
15 |
31 |
35 |
11 |
< 1 |
4 |
14 |
160 |
|
Percentage |
3% |
27% |
9% |
19% |
22% |
7% |
< 1% |
3% |
9% |
100% |
Catch Basins
Catch basins are chambers or wells, usually built at the curb line of a street, where surface water enters a storm sewer or sub-drain. At the base is a sediment sump designed to retain grit and detritus below the point of overflow.
Ditches
Ditches are long narrow excavations dug in the earth for drainage, with their top width less than 10 feet at design flow. The Utility has mapped 10.86 miles of public ditches and 2.71 miles of private ditches, and has an ongoing effort to map all ditches within the City.
Manholes
Stormwater manholes provide underground access to a vault for inspections and maintenance. Manholes are located at junctions where several pipes meet, pipes change direction, a flow control structure is needed, or sometimes where pipes change size.
Flow Control Structures
Flow control structures are designed to mitigate the impacts of increased surface and stormwater runoff flow generated by development. Flow control facilities are designed to control volume, rate, frequency, and flow duration through evaporation, plant transpiration, and/or infiltration into the ground; or they may be designed to hold runoff for a short period, releasing it to the conveyance system at a controlled rate. Table 4.6 lists the flow control structures in Olympia’s stormwater system.
|
Flow Control Type |
Number of Public Flow Control Structures |
Number of Private Flow Control Structures |
|---|---|---|
|
Combined Detention/Infiltration |
5 |
22 |
|
Detention Pond |
37 |
176 |
|
Detention Tank |
0 |
2 |
|
Detention Under Pavement |
2 |
79 |
|
Detention Vault |
7 |
99 |
|
Drywell |
26 |
60 |
|
Infiltration Basin |
14 |
94 |
|
Infiltration Under Pavement |
15 |
42 |
|
Infiltration Vault |
0 |
9 |
|
Infiltration Trench |
61 |
262 |
|
Parking Lot |
0 |
7 |
|
Total |
167 |
852 |
Treatment Facilities
Stormwater treatment facilities are structures or systems designed to reduce or remove pollutants and/or control flow or volume. Natural treatment occurs in streams, wetlands, and lakes. Structures provide varying levels of treatment through settling of particulate pollutants using gravity, centrifugal separation, and/or filtration by biological uptake or media/soil adsorption. Larger facilities such as Black Lake Meadows and Yauger Park are considered regional treatment facilities.
Levels of Treatment
Olympia’s Drainage Design and Erosion Control Manual (DDECM), Volume 1 lists the core stormwater management requirements for new development and redevelopment and includes the type(s) and level(s) of stormwater treatment required. The levels of stormwater treatment determined by the DDECM are described below as defined by the Washington State Department of Ecology and shown in Table 4.7.
• Pretreatment. Intended to achieve 50% removal of fine (50-micron mean size) and 80% removal of coarse (125-micron mean size) total suspended solids for influent concentrations greater than 100 mg/L, but less than 200 mg/L. For influent concentrations less than 100 mg/L, these facilities are intended to achieve effluent goals of 50 mg/L of fine and 20 mg/L of coarse total suspended solids.
Pretreatment is necessary in areas where the basic treatment facility or the receiving water may be adversely affected by non-targeted pollutants or may be overwhelmed by a heavy load of targeted pollutants. Filtration and infiltration facilities often need protection from clogging, which can be achieved with pretreatment devices such as a pre-settling basin, wet pond or vault, biofilter, constructed wetland, or an oil/water separator.
• Oil Treatment. Intended to achieve the goals of no ongoing or recurring visible sheen and a daily average total petroleum hydrocarbon concentration no greater than 10 mg/L with a maximum of 15 mg/L for discrete (grab) samples.
Oil/water separators remove oil floating on the top of the water and are necessary in high-use sites that generate high concentrations of oil due to high traffic turnover or the frequent transfer of oil such as parking lots, vehicle maintenance and repair sites, and fuel stations.
• Basic Treatment. Intended to achieve a goal of 80% removal of total suspended solids for an influent concentration range of 100 mg/L to 200 mg/L. For influent concentrations less than 100 mg/L, the effluent goal is 20 mg/L total suspended solids.
Basic treatment is viewed as a minimum technology-based requirement that must be applied regardless of the quality of the receiving waters.
• Enhanced Treatment. Intended to achieve a higher level of treatment than basic treatment. Enhanced treatment is targeted at removing dissolved metals and usually involves two or more treatment levels before stormwater is discharged from the treatment facility.
|
Treatment Facility Type |
Treatment Level |
Number of Public Facilities |
Number of Private Facilities |
|---|---|---|---|
|
Bioretention Pond |
Enhanced |
17 |
23 |
|
Biofiltration Swale |
Basic |
12 |
63 |
|
Catch Basin Insert |
0 |
1 |
|
|
Constructed Wetland |
Enhanced |
3 |
4 |
|
Filterra Unit |
Enhanced |
17 |
1 |
|
Filter Strip |
Enhanced |
2 |
17 |
|
Modular Wetland |
Basic |
8 |
0 |
|
Oil/Water Separator |
Oil Control |
5 |
45 |
|
Enhanced |
1 |
20 |
|
|
Sand Filter |
Enhanced/Oil Control |
0 |
2 |
|
Storm Filter Cartridge Vault |
Basic |
18 |
202 |
|
Vortech/Stormceptor Vault |
9 |
21 |
|
|
Wet Pool (Wet Pond) |
Basic |
37 |
124 |
|
|
Total |
129 |
523 |
Regional Treatment Facilities
The Utility has designed and constructed more than a dozen regional infrastructure improvement projects that manage stormwater flow and improve water quality. The larger facilities are described below.
Yauger Park Regional Stormwater Complex
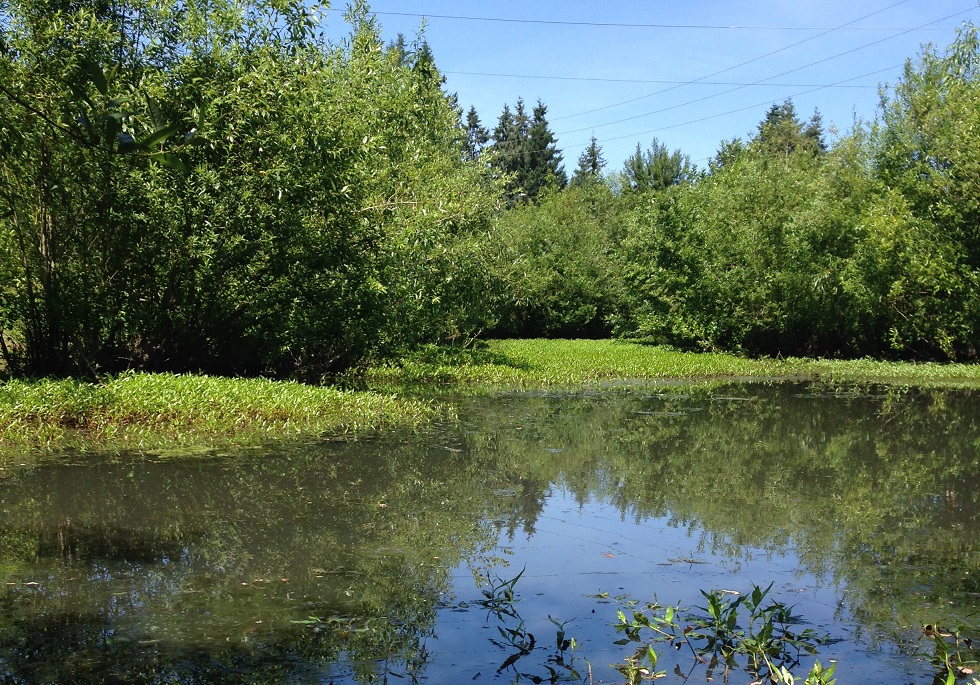
West Olympia’s Yauger Park serves the community as both a recreational park and a regional stormwater facility that receives runoff from over 700 acres. The 29-acre stormwater facility was constructed in 1977 when the Capital Mall was built. In 2010, the detention pond was deepened and enlarged to create more stormwater storage capacity and add water treatment. When full, the pond can hold up to 27 million gallons of water. The stored water is gradually released to Black Lake Meadows, then through Percival Creek, and ultimately flows into Budd Inlet. The landscaped wet pond, wetland, rain gardens, and forebays provide stormwater treatment in an attractive natural environment.
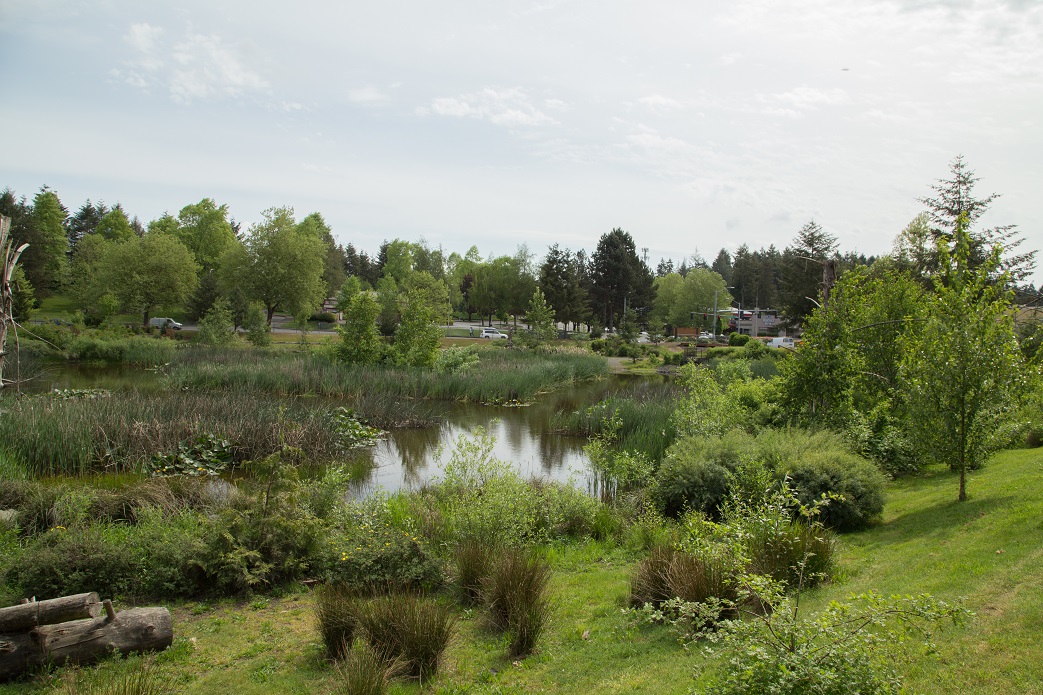
West end of Yauger Park Regional Stormwater Complex Pond (May 2016)
Black Lake Meadows Stormwater Complex
Black Lake Drainage Ditch was constructed in 1922 to drain land north of Black Lake. The adjacent 42-acre Black Lake Meadows wetlands was purchased in 1995 for use as storage, infiltration, and treatment of stormwater discharged from many commercial districts in west Olympia, including discharge from the Yauger Park stormwater pond. The complex is a series of ponds on the north side of Black Lake Ditch and a constructed wetland on the south side. This facility protects stream habitat and water quality and provides a home to wildlife. Black Lake Meadows is rich in bird diversity, with a large variety of pond and nesting habitat.
Black Lake Meadows Stormwater Complex (May 2017)
Taylor Wetlands Complex
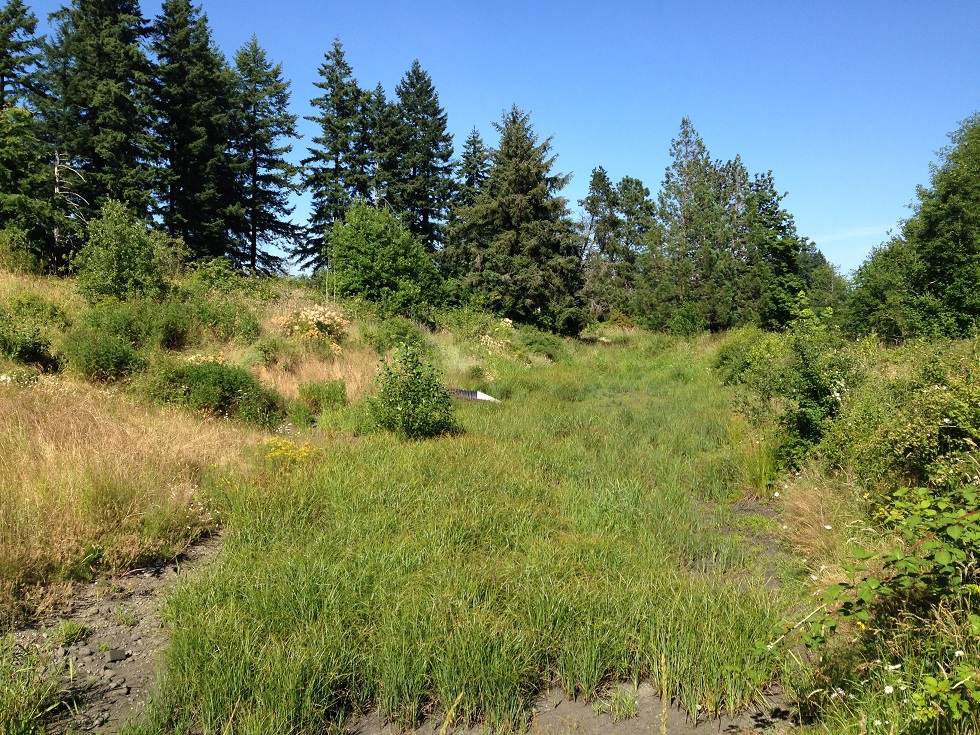
The Taylor Wetlands Complex is a series of ponds that provide water quality treatment and flow control for runoff from approximately 190 acres of primarily commercial property in the Woodard Creek basin. The facilities receive a portion of the runoff from the South Sound Shopping Center. The City of Olympia owns and maintains the facilities near the Taylor Wetlands, south of the Olympia Woodland Trail and the City of Lacey owns and maintains an upstream water quality facility.
South End of Fones Road Stormwater Facility (May 2017)
Giles Avenue Treatment Facility
The Giles Avenue treatment facility is a two stage treatment train that provides treatment for runoff from approximately 180 acres in the upper Schneider Creek basin. Runoff is pretreated by a Contech CDS swirl concentrator that hydrodynamically separates and traps sediment and debris. Pretreated stormwater is then filtered through an 80 cartridge Contech Storm Filter that further removes sediment and metals.
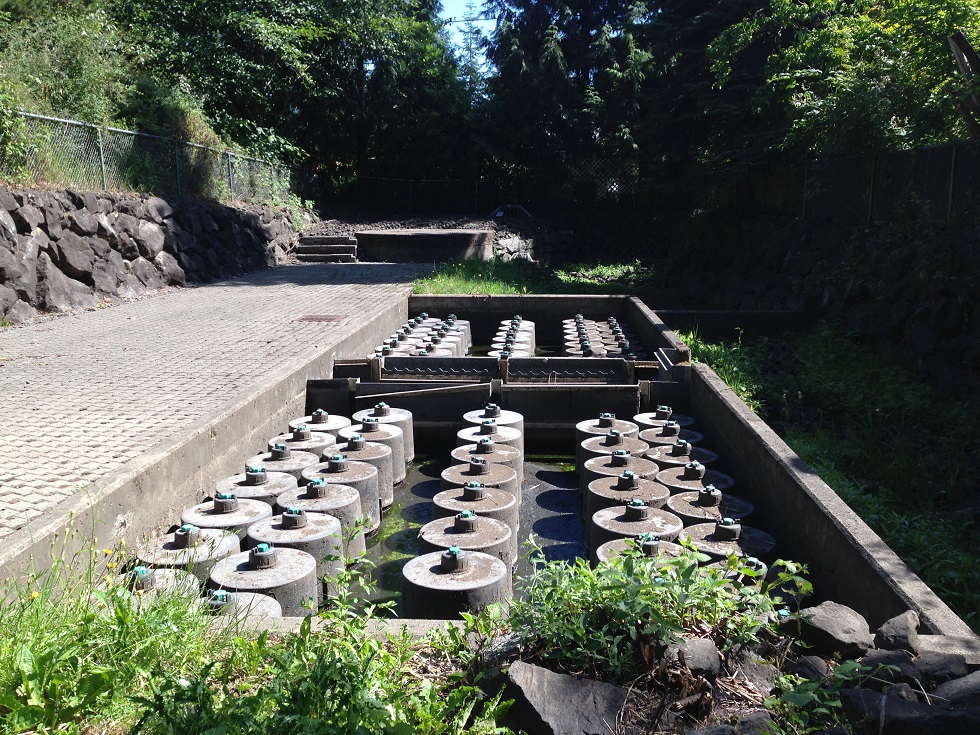
Giles Ave Treatment Facility (May 2017)
Indian Creek Stormwater Complex
The Indian Creek Stormwater Complex is located at the corner of Frederick Street and Wheeler Avenue on two acres adjacent to the Woodland Trail. The project was originally constructed in 2001 as a joint effort by the City, Washington State Department of Transportation, and the Olympia Arts Commission. The project’s innovative use of art, engineering, and the natural environment earned a Federal Environmental Protection and Enhancements Merit Award. Its design integrates treatment function, slope stabilization, and natural elements with public art. The sequence of stormwater facilities slows down and filters out larger items, soils, and sediments in stormwater coming from Interstate-5 as it moves toward Indian Creek. Several native plants were reintroduced to the site, creating a tranquil setting in an urban environment.
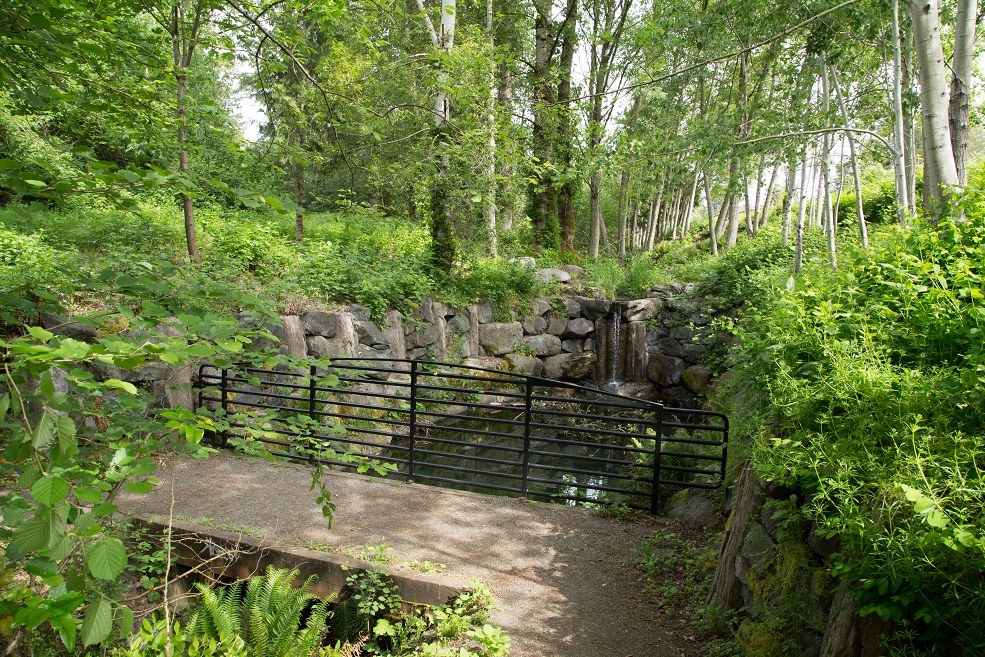
Clarification Pond at Indian Creek (May 2016)